
⚡ GMapsBook.com is crafted by Jozef Sorocin (🟢 Book a consulting hour) and powered by:
- Spatialized.io (Elasticsearch & Google Maps consulting).
- and Garages-Near-Me.com (Effortless parking across Germany)
From SVGs to vectors & WebGLShould you use a Vector Google map?From WebGL to Deck.glUsing Deck.gl with Google MapsVector overlaysRaster tile overlaysFrom Deck.gl to CARTOCARTO’s roleAnalytics ToolboxUse CaseApproach
Until now we’ve only dealt with raster maps. Your Google map is raster by default — unless you create a Vector Map ID and initialize your instance with it.
With raster maps, 2D image tiles are stitched together to form the map canvas. This technique has stood the test of time and powers millions of Google maps on websites and in mobile apps.
But this tiling approach has some downsides too:
- With slower connection speeds, there’s perceptible tile loading.
- Aside from the 45° tilting available in the satellite & hybrid modes, there’s no support for immersive 3D experiences. Everything stays flat.
- Even though the map tiles are internally composed of layers, Google doesn’t let us intercept, adjust, or alter these layers in any way. Consequently, all artifacts and overlays must be placed on top of the map canvas.
On top of that, with the ever-improving performance of evergreen browsers, web users started to expect more — more immersiveness, more customization, more spark.
Google’s competition didn’t sleep either. For instance, work on Mapbox’s answer to Google’s inaction began in 2013 — back when the underlying technology — WebGL — was still in its infancy.
In 2020, Google finally released its take on vector maps. These days (2023), vector maps are freshly out of beta and here are a few sneak peeks of what you can already do with them:
In this chapter, we will:
- Explore vector maps — when to use them, and more importantly, when not to use them.
- Learn to utilize WebGL via Deck.gl — even without vector maps.
- Discover CARTO and learn how to effortlessly visualize large-scale geospatial datasets with tilesets and WebGL.
From SVGs to vectors & WebGL
Think about a raster marker label icon again. A JPEG icon specifies each pixel’s position and color. A PNG icon does the same but adds information about the transparency of each pixel. Naturally, when you upsize the icon and/or serve the same icon to devices with varying pixel density, the icons will appear pixelated.
Now, in 🏷️ Custom Marker Labels you learned that Scalable Vector Graphics (SVGs) don’t pixelate. You see, SVGs instruct the browser how to render elements like lines, rectangles, and curves based on 2D vector geometry and various attribute conventions. The browser then renders the final result at any scale without pixelation.
As it turns out, 2D calculations can be pretty fast. But they’re even faster if the linear algebra behind these calculations runs on the device’s GPU — as opposed to its CPU.
And that’s where the Web Graphics Library (WebGL) comes in. WebGL is a JavaScript API based on OpenGL, which itself is, as the web-map legend Volodymyr Agafonkin put it:
a technology for drawing triangles really fast.
Using shaders, WebGL then does the heavy lifting to transform triangle vertices into screen vertices and calculate the final pixel colors. And that’s how 2D becomes 3D — using linear algebra, the height dimension is projected and appropriate colors get added.
But back to maps. Vector maps promise to offer:
- Smoother transitions. Since the map “scene” is calculated on the client’s device, interacting with the map feels more natural. There’s no integer zoom — so there’s less jitter and more fluidity.
- More control over data presentation. There’s barely any distinction between the basemap and its layers — everything is a layer, including the overlays.
- Shared rendering context. Google Maps provides direct access to the WebGL context that the vector base map renders into. This lets you integrate 2D/3D content with basemap rendering and create immersive experiences that look & feel right.
- More interactivity & better performance. Standard artifacts like markers, lines, and shapes are HTML nodes — and there’s a soft limit of around 1,000 that you can render without noticeably worsening the map’s performance. With vector maps, thousands of artifacts can be efficiently rendered within the WebGL context and their positioning is recalculated by the GPU.
Should you use a Vector Google map?
To reiterate, vector maps freshly out of beta so their documentation is limited at best. This means that you should reach for a vector map only if you know your way around WebGL and related JavaScript frameworks like Three.js.
In 95% of use cases, you’re still better off with raster maps because:
- They tend to load faster.
- They’re well-customizable.
- They’re crawlable by bots. WebGL isn’t.
- Some people may not have WebGL enabled in their browser or their devices (esp. phones) aren’t powerful enough to render WebGL transitions smoothly. Side note: Google Maps will automatically default back to raster if it detects no support for WebGL.
- Lots of people actually prefer reduced motion and fewer animations. Investing huge efforts into flawlessly animating your WebGL scenes may not be worth it — and may even be counterproductive. Vice versa, investing too little effort may produce sloppy results.
- Last but not least, most people are used to simple websites. Impressing management with complex 3D scenes isn’t necessarily going to impress your clients and/or customers.
Switching from a raster to a vector map is as easy as swapping the
mapId. If Google determines that the device doesn’t support WebGL (you can check this yourself programmatically as well), it’ll automatically fall back to raster rendering.In spite of the current state of vector Google maps, WebGL is still exciting.
If only there was a way to take advantage of its vector capabilities and use it with raster maps…
Except there is!
From WebGL to Deck.gl
Remember Kepler.gl from the previous chapter?
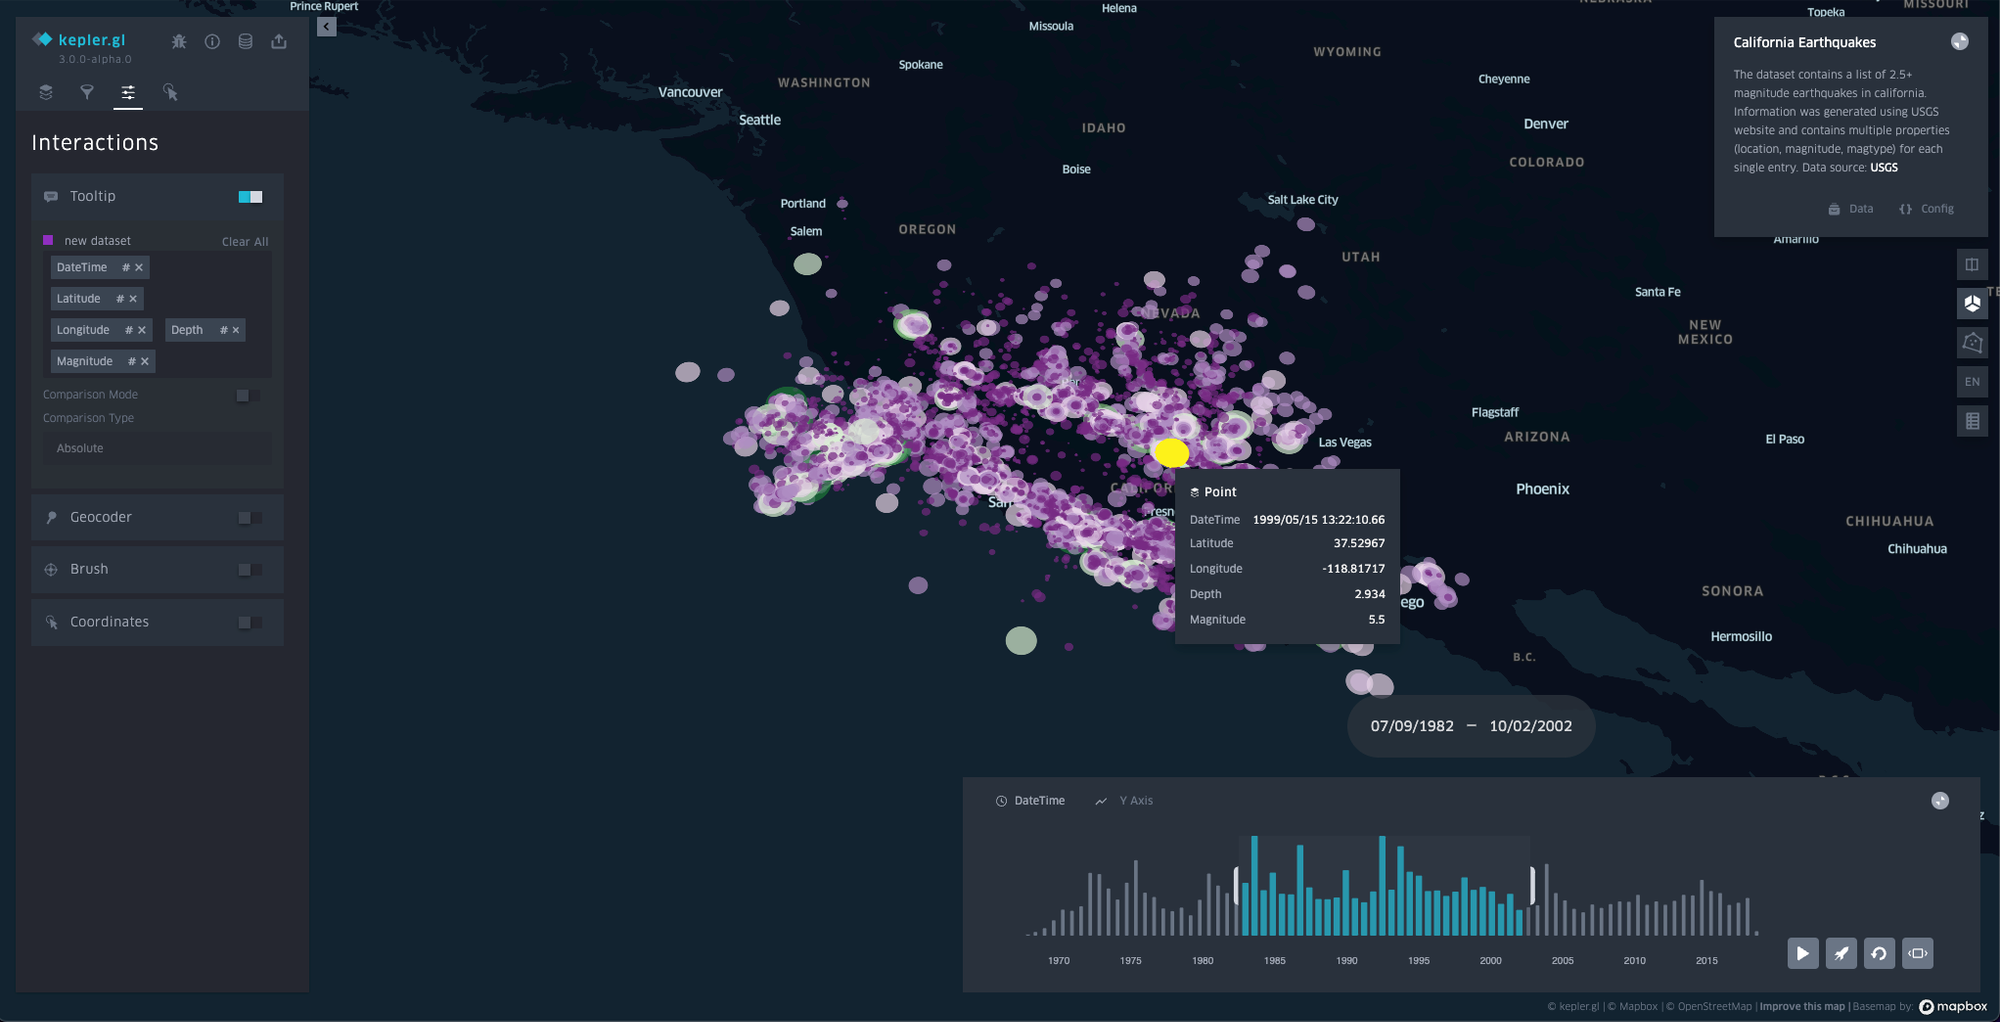
Under the hood, Kepler is powered by vis.gl — a suite of interoperable open-source geospatial frameworks. Most notably:
- luma.gl → The high-performance GPU rendering & compute toolkit.
- math.gl → The 3D & WebGL math library.
- loaders.gl → A collection of loaders modules for Geospatial & 3D visualization use cases like loading a wide variety of data formats into Kepler.gl/Deck.gl.
- And, last but not least: deck.gl → The framework for a layered approach to exploratory geospatial data visualization.
The good news is, you can easily integrate Deck.gl with major basemap providers like Google Maps.
Using Deck.gl with Google Maps
With Google Maps’ native data layers, you work with
map.data to A) load a GeoJSON data set, B) dynamically style the features, and C) add interactivity callbacks that may or may not alter the layer’s presentation.All of this is possible with Deck.gl too — but instead of callback hell, you work with sets of composable
layers, each of which has properties that determine the layer’s data source, presentation, and interactivity.Vector overlays
To start off, let’s revisit the GeoJSON scenario from the previous chapter:
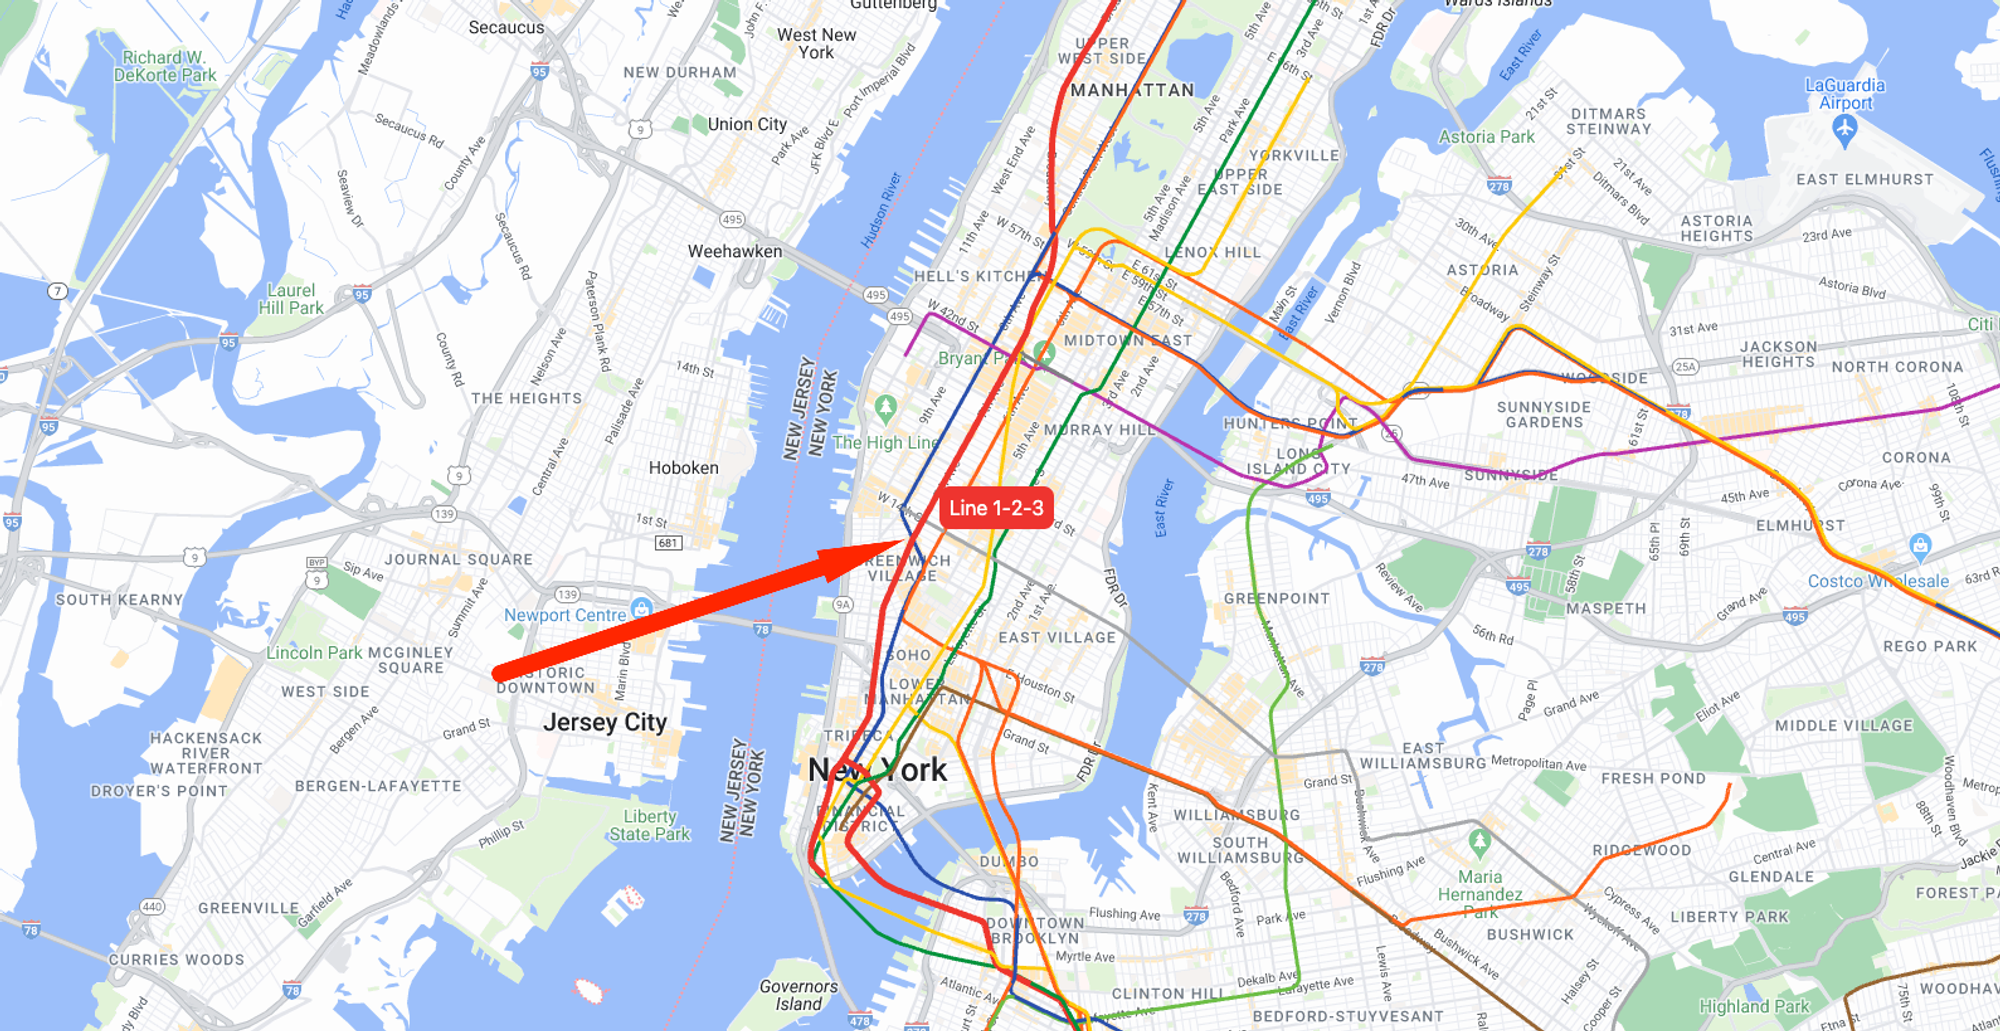
Here’s what you could do with Deck.gl:
const linesLayer = new GeoJsonLayer({
	// you can customize the data loading behavior
	// https://deck.gl/docs/developer-guide/loading-data#customize-data-loading-behavior
	data: 'https://',

	getLineWidth: (feature) => getLineWidth(feature.properties.subwayLineName),
	getLineColor: (feature) => getLineColor(feature.properties.subwayLineName),

	onHover: (args) => {
		// toggle tooltip based on x,y coords
		// toggle line width of the currently hovered line
	}
})

// construct the WebGL overlay
const deck = new GoogleMapsOverlay({
  layers: [linesLayer],
});

// connect the overlay with the map
deck.setMap(map);