Originally, web maps were displayed as a single image, which made it difficult to zoom in/out or pan across the map without significant distortion or loss of detail.
Today, map tiling is a fundamental part of most web mapping platforms, including Google Maps. By breaking Google Maps into small, standardized tiles of 256 × 256px, the map canvas can be loaded on demand and displayed quickly at different scales. This allows users to zoom in and out without losing detail or experiencing lag time.
🔑
In addition, map tiling has made it possible to overlay other types of data on top of maps, such as traffic updates, weather data, and satellite imagery. This has opened up new possibilities for using maps as a tool for visualizing and analyzing complex datasets.
Inspecting Google’s tile service
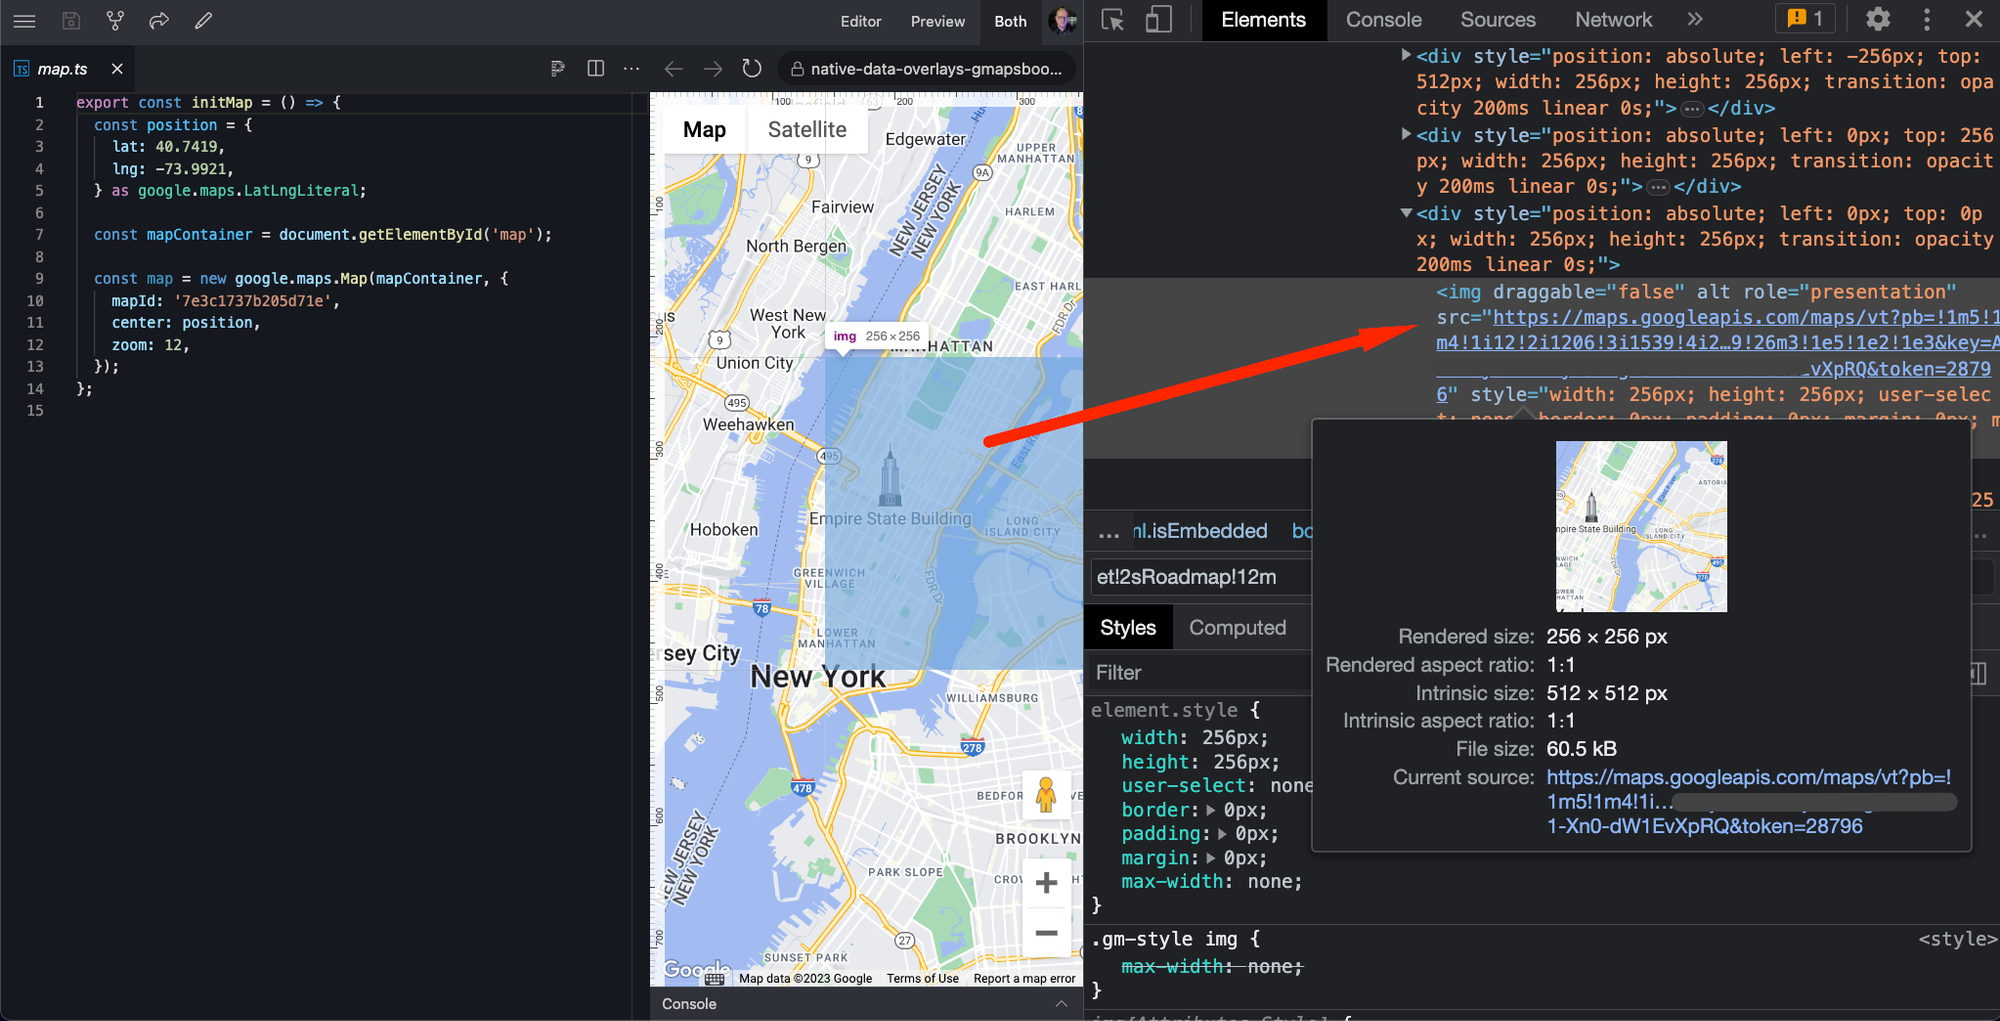
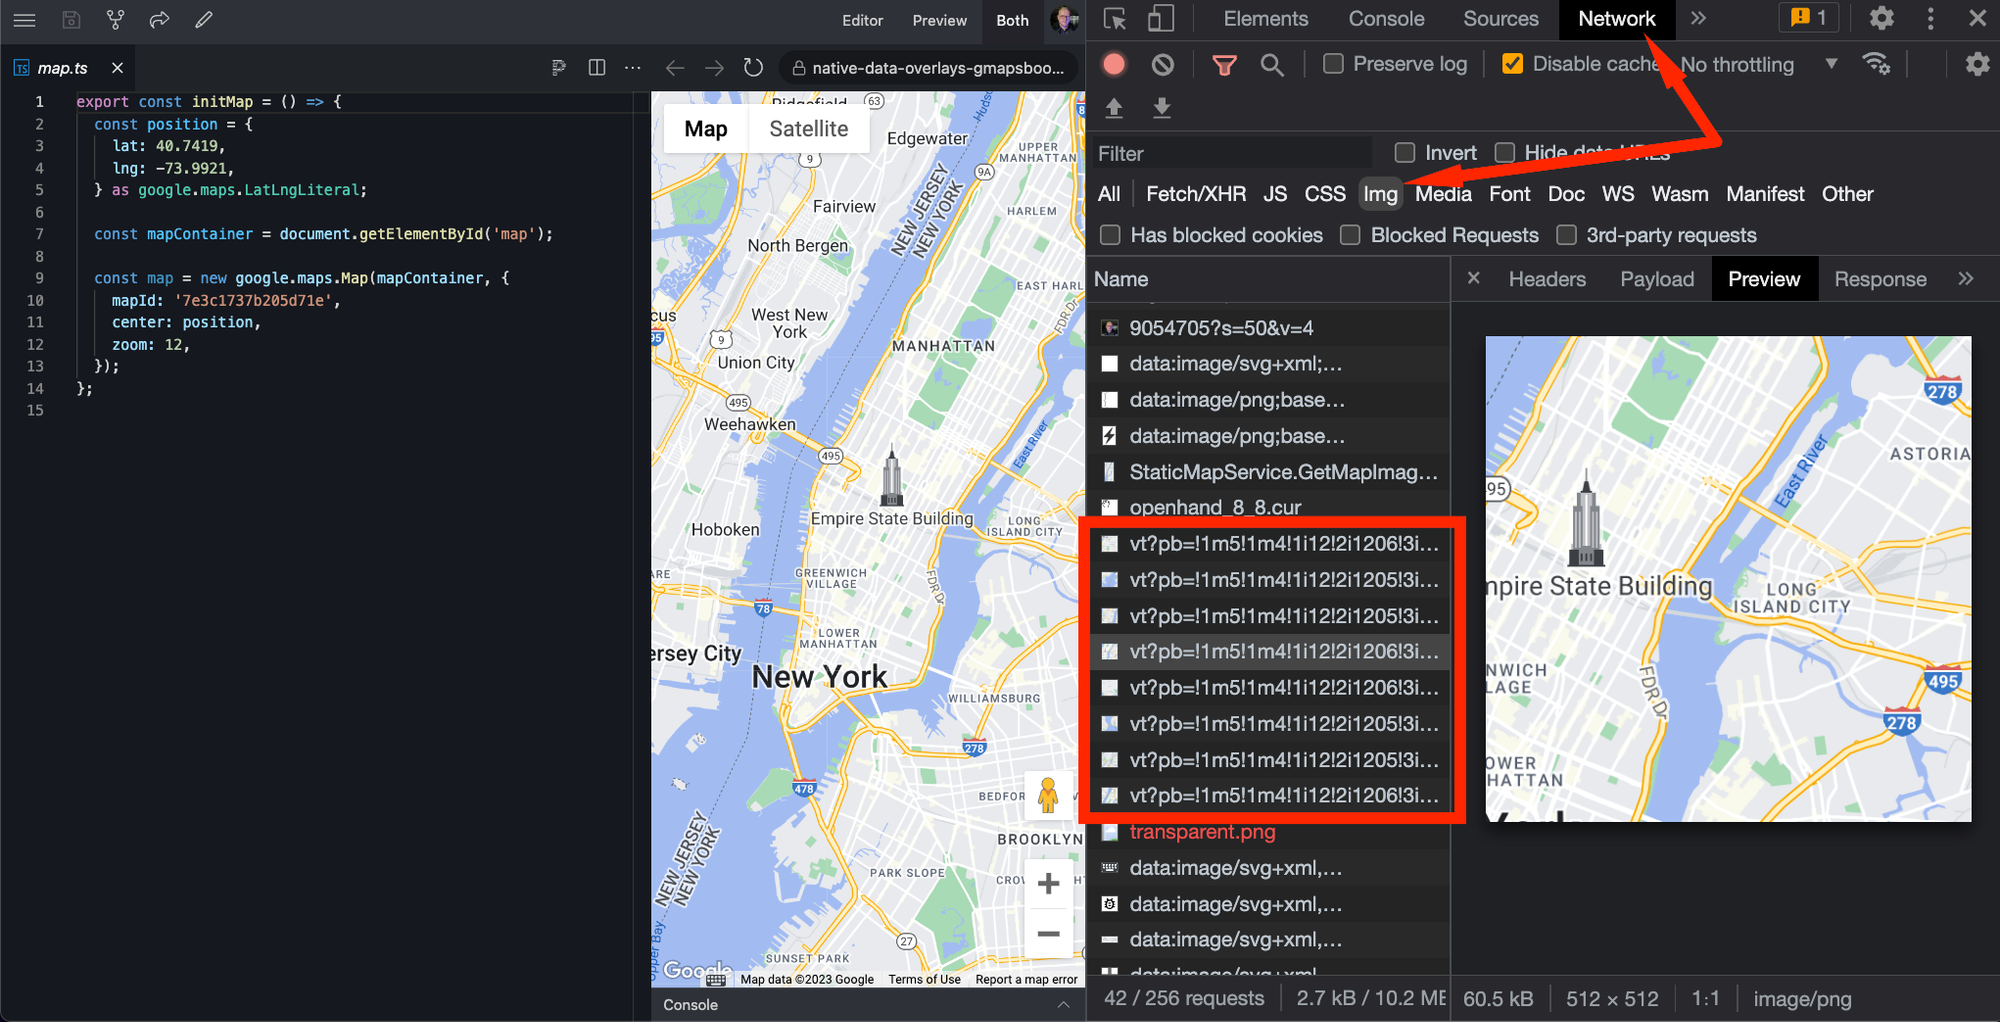
When you load a raster-based map and inspect the container’s HTML deeply enough, you’ll see that your Google Map is indeed a set of roadmap image tiles elegantly stitched together:
Tip: you can listen to the tilesloaded event to know when the visible tiles have finished loading:
map.addListener('tilesloaded',()=>{// proceed with business logic});
From satellite imagery to roadmap tiles and back
As you switch from the roadmap to the satellite map type with the Network Dev Tools still open, you’ll notice something peculiar — the raw satellite tile is overlaid with a transparent “labels” tile: