
⚡ GMapsBook.com is crafted by Jozef Sorocin (🟢 Book a consulting hour) and powered by:
- Spatialized.io (Elasticsearch & Google Maps consulting).
- and Garages-Near-Me.com (Effortless parking across Germany)
ScenarioApproachFinding the right dataA proof of conceptSelective & declarative stylingInteracting with data layer eventsHighlighting a lineReverting the highlightingAttaching a tooltipPutting it all together
In the parent chapter we briefly explored Google Maps’ native transit layer.
In this chapter, we’ll attempt to replicate this layer using publicly available GeoJSON data and learn a thing or two about Google Maps’ interactive data layers.
Scenario
I’m a city planner analyzing the proximity of New York City subway lines to new developments.
To start off, I’d like to view and highlight the metro lines:
Approach
As you saw in the chapter on Turf.js & Exporting to GeoJSON, the GeoJSON format is a popular mechanism to encode and share geospatial data.
Finding the right data
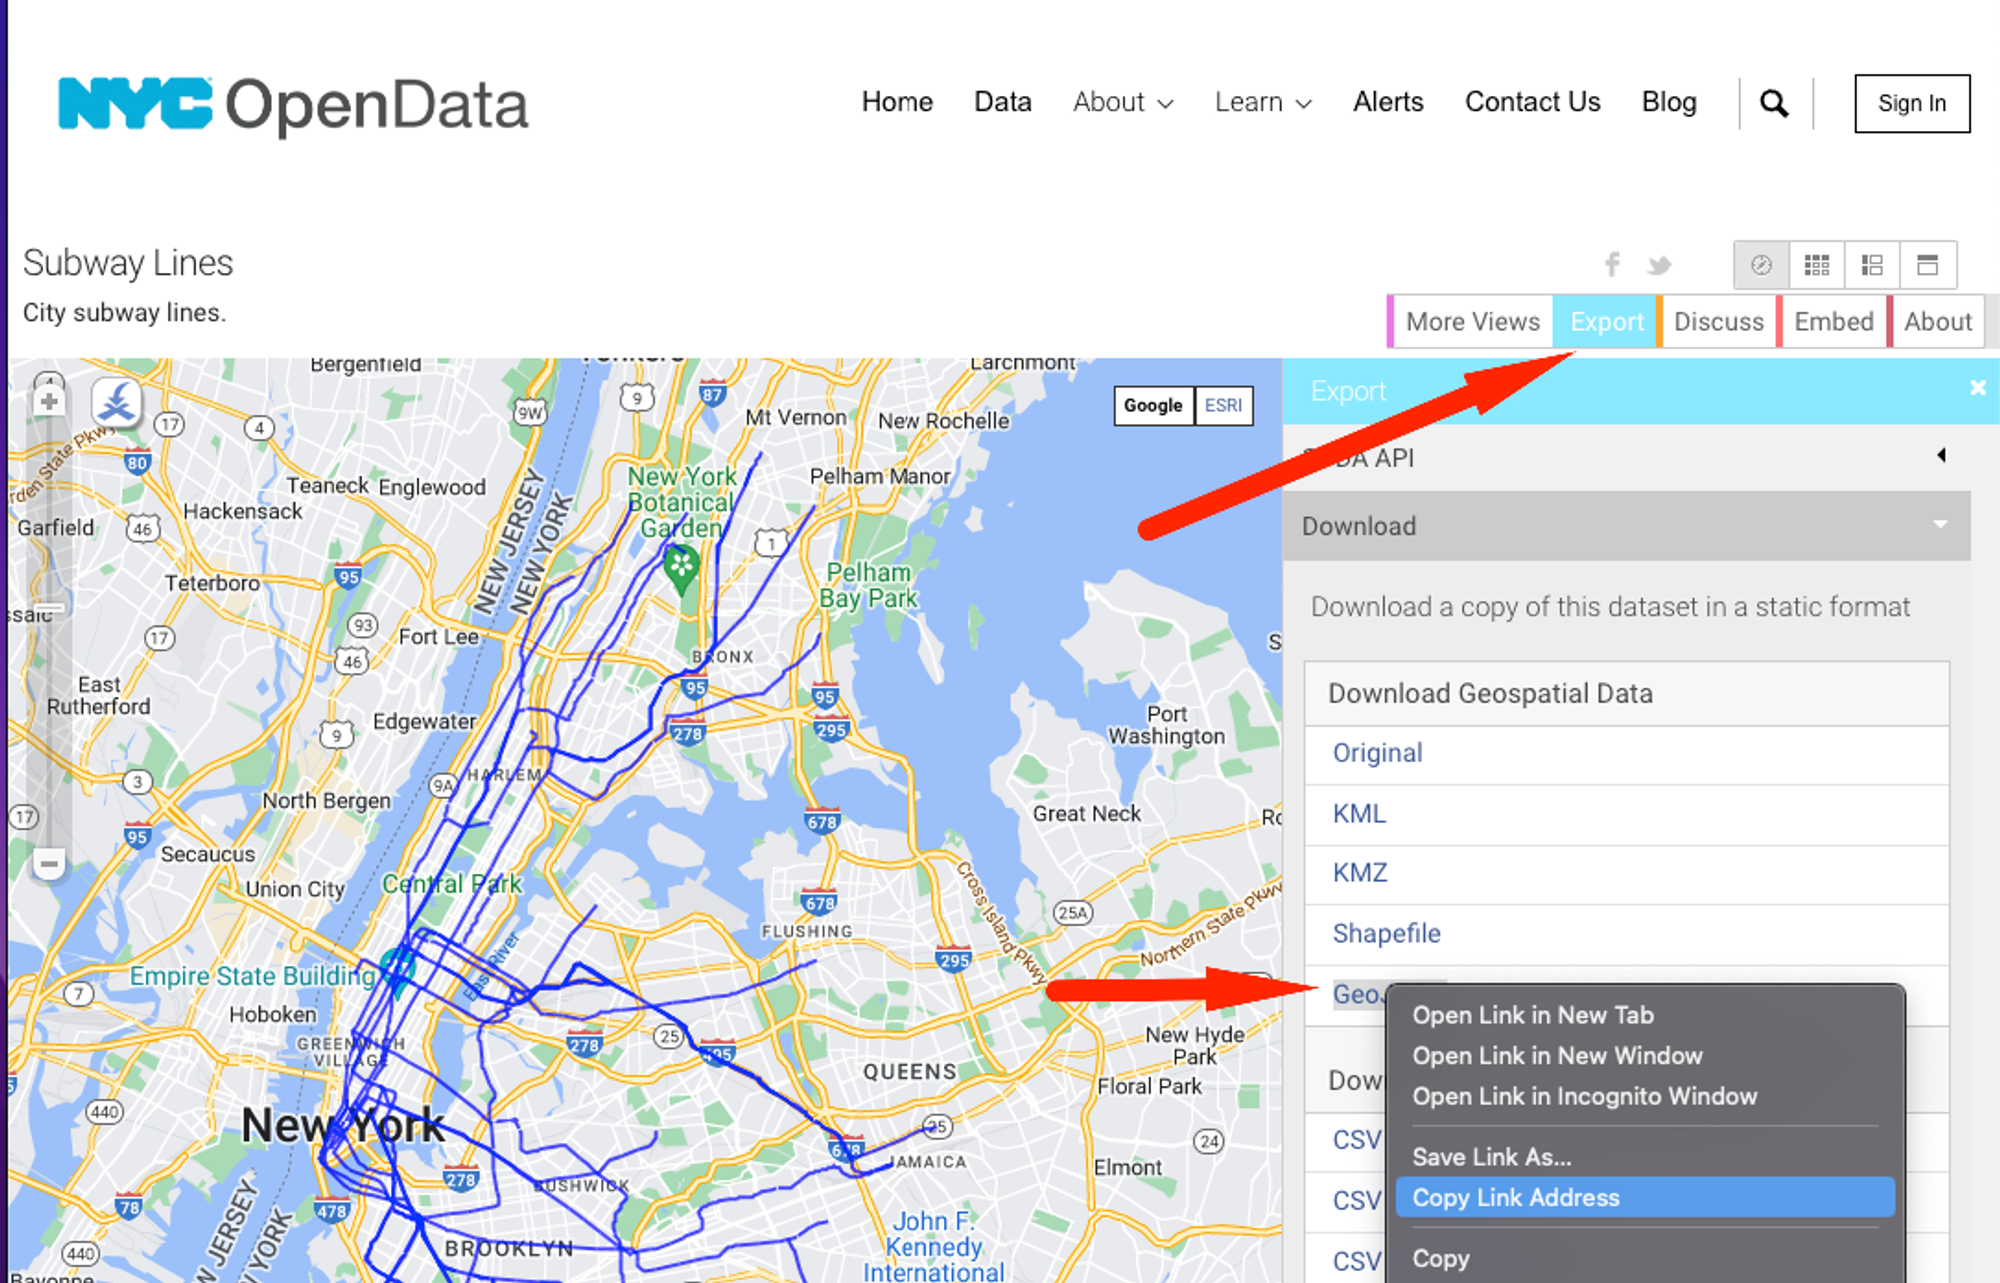
Many cities, agencies, and non-profits publish valuable GeoJSON data online. In your case, the city agency of choice would be NYC Open Data. Searching for “subway lines” leads to a promising dataset. From there, under “Export”, you’ll need to copy the GeoJSON URL:
To quickly inspect the geometries and
properties of this small dataset, you can use geojson.io.Indeed, you’re dealing with a
FeatureCollection containing features of the form:{
"type": "Feature",
"properties": {
"name": "A-C",
"url": "http://web.mta.info/nyct/service/",
"rt_symbol": "A",
"objectid": "800",
"id": "2000251",
"shape_len": "2714.92372395"
},
"geometry": {
"type": "LineString",
"coordinates": [
[-73.88075000161994, 40.674129666468296],
[-73.89035800079188, 40.67270966767174]
]
}
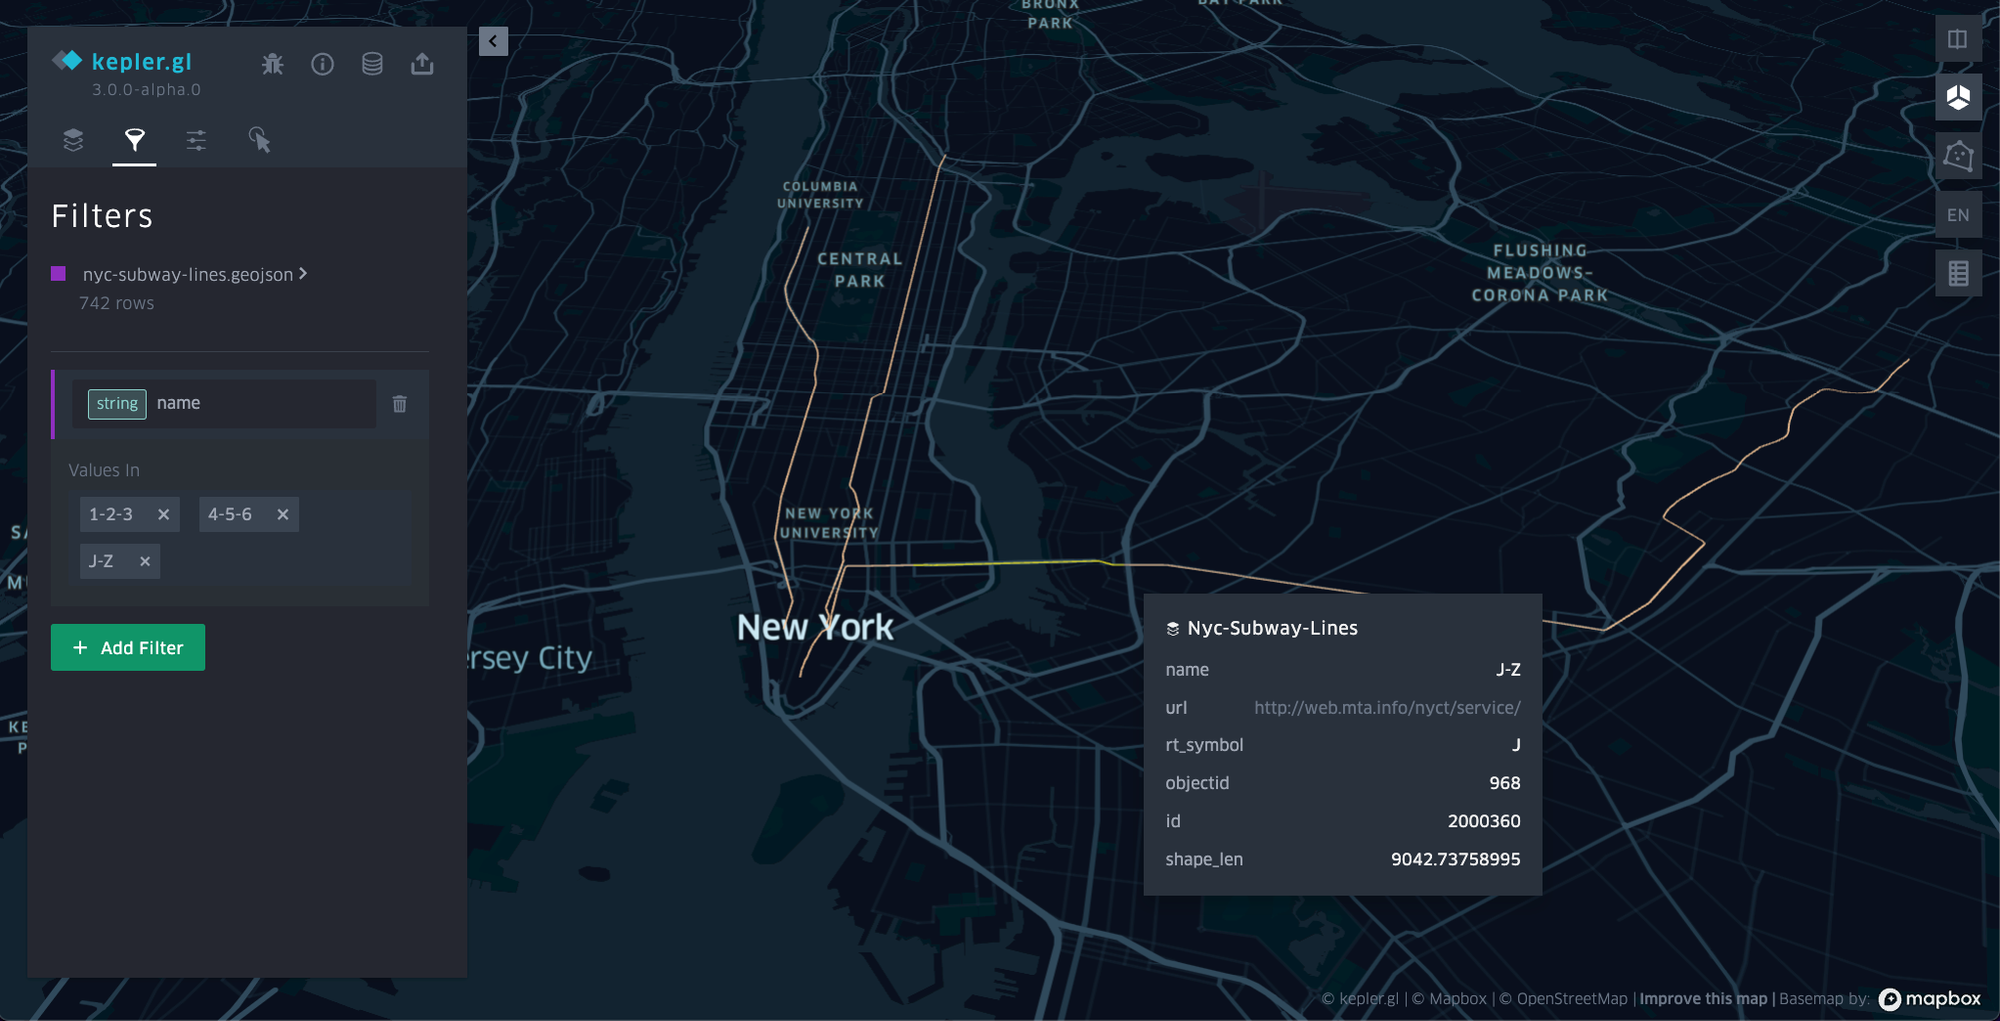
}If the file were bigger (in the 10Mb+ range), you’d be better off with a tool like kepler.gl.
Kepler.gl is a super fast, WebGL-powered online tool that lets you visualize, pick, filter, search and share geo data in various formats with ease:
A proof of concept
Once you’ve familiarized yourself with the structure of the GeoJSON file, it’s time to connect it to a Google Map via the
map.data.loadGeojson() method:map.data.loadGeoJson(
'https://data.cityofnewyork.us/api/geospatial/3qz8-muuu?method=export&format=GeoJSON'
);⚙ Some public-facing GeoJSON endpoints may block such requests due to CORS.
If the desired dataset is static (doesn’t change over time), you can download and store it in a Github Gist or on your own server.
If the dataset changes over time, you can fetch the GeoJSON separately and pass it onto the map canvas via
map.data.addGeoJson.Once the data has loaded, you’ll see the
LineString geometries in the default black stroke: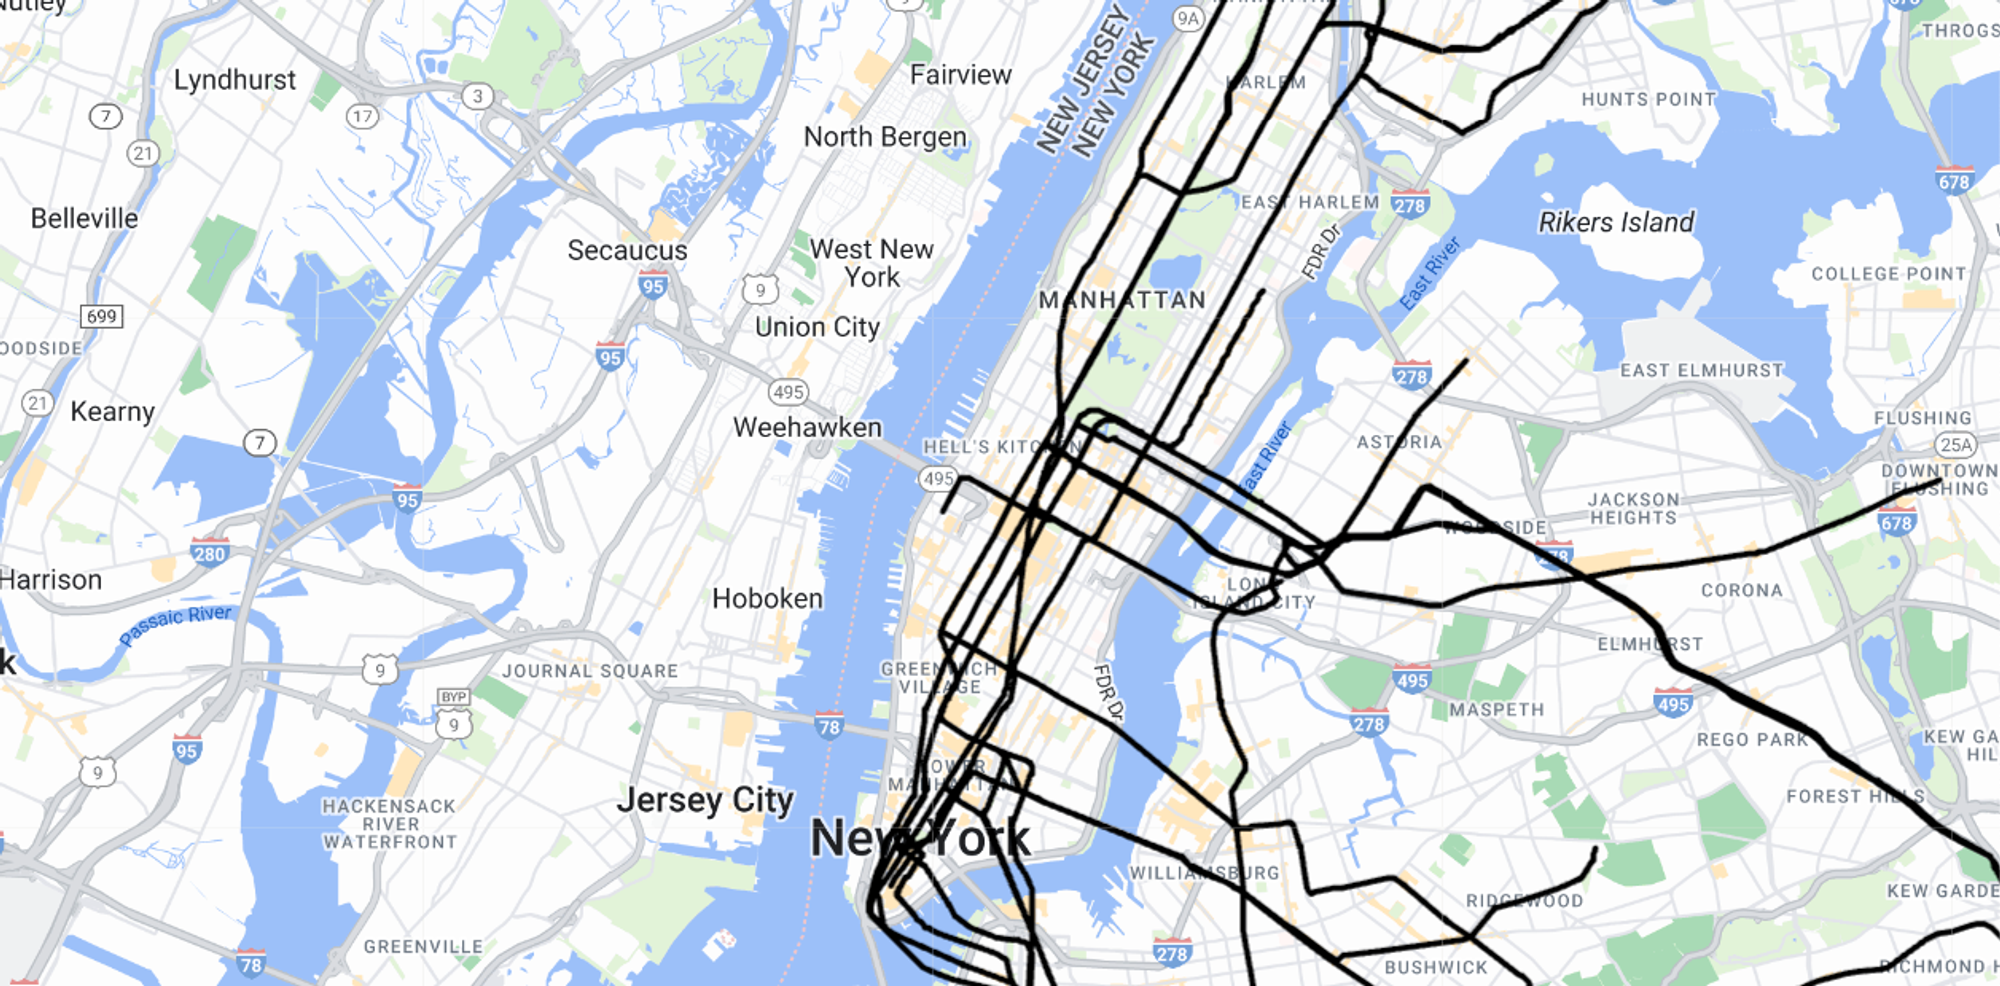
Selective & declarative styling
Since the GeoJSON is composed of multiple
features, you can apply custom styling to each feature independently using familiar properties like strokeColor and strokeWeight:map.data.setStyle((feature) => {
return {
// randomizing the stroke color for illustration purposes
strokeColor: Math.random() < 0.5 ? 'orange' : 'purple',
strokeWeight: 4,
};
}); 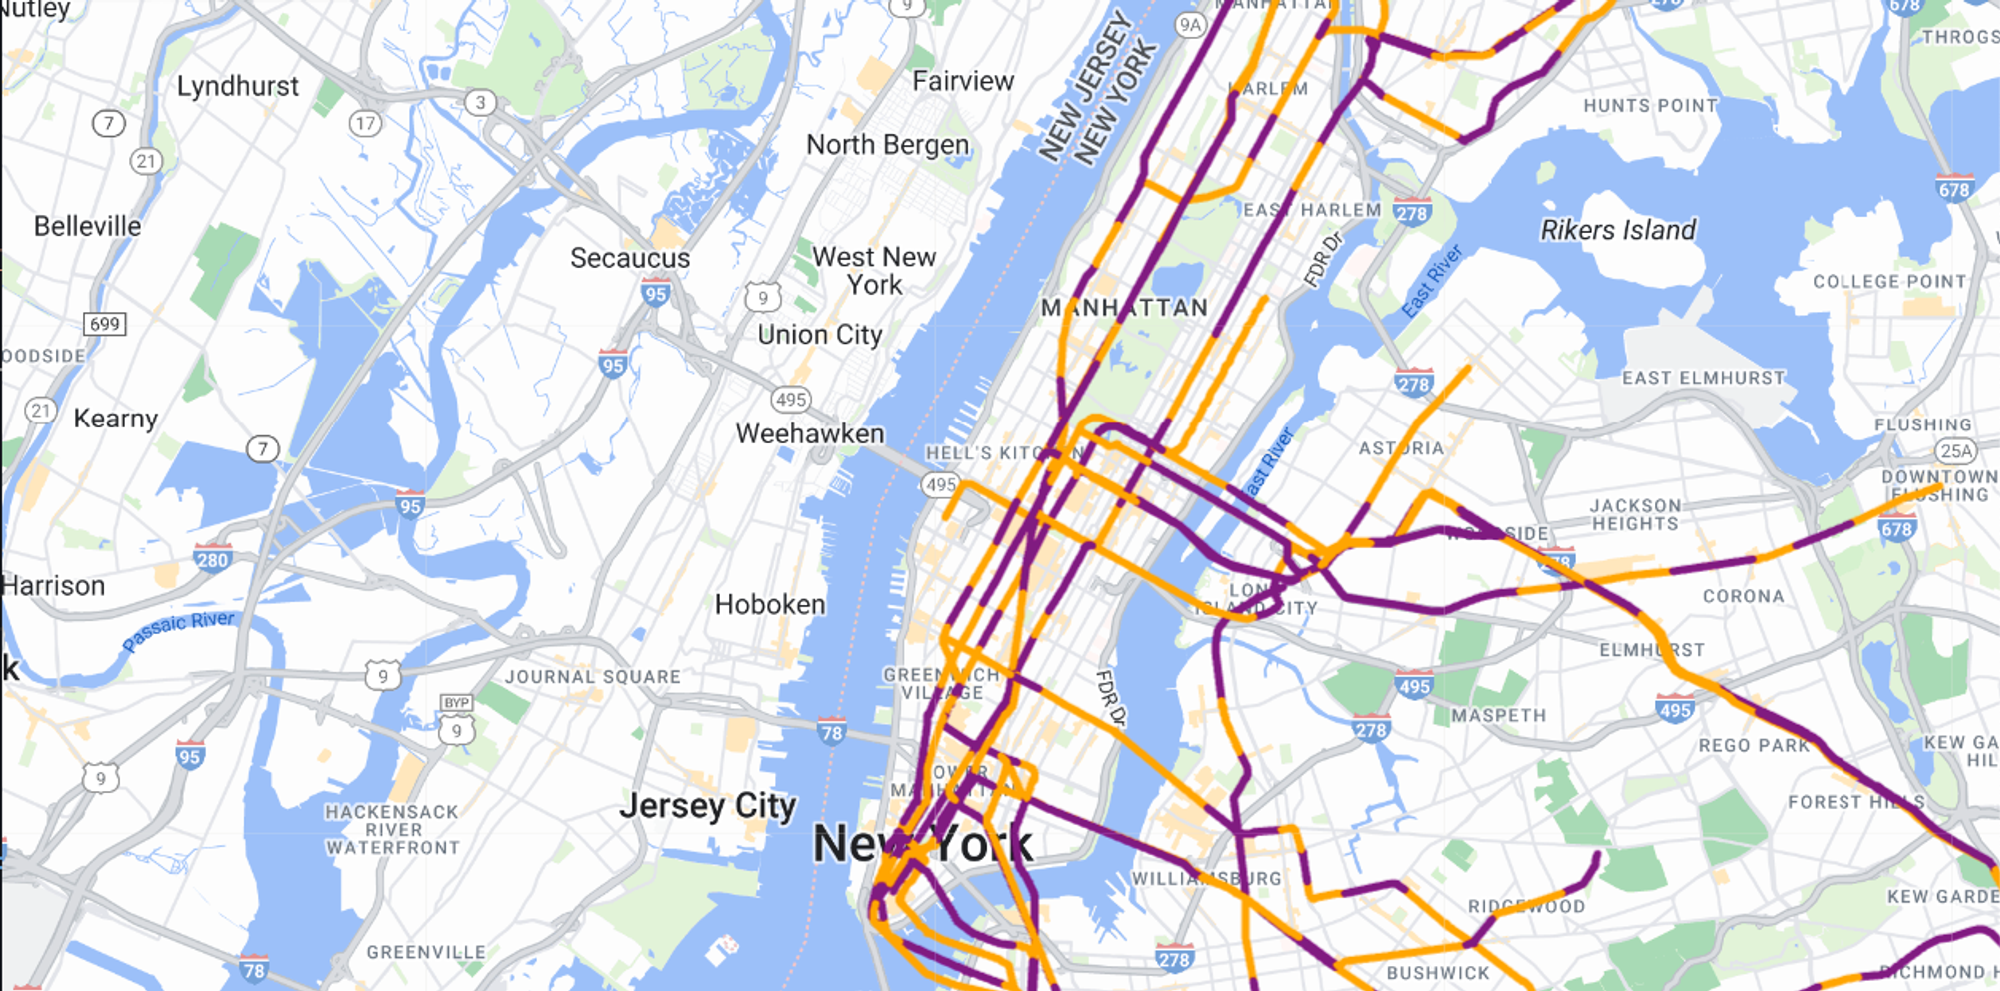
Notice that the subway lines aren’t complete
LineStrings but rather separate line segments. Still, you’ll need grouped segments in order to display continuous lines.At this point you essentially have two options:
- Post-process the GeoJSON with a tool like Turf.js and combine the
LineStringsinto aMultiLineStringso it can be treated as a distinct feature.
- Or, apply some clever logic and take full advantage of per-feature styling.
You guessed it — option #2 it is.
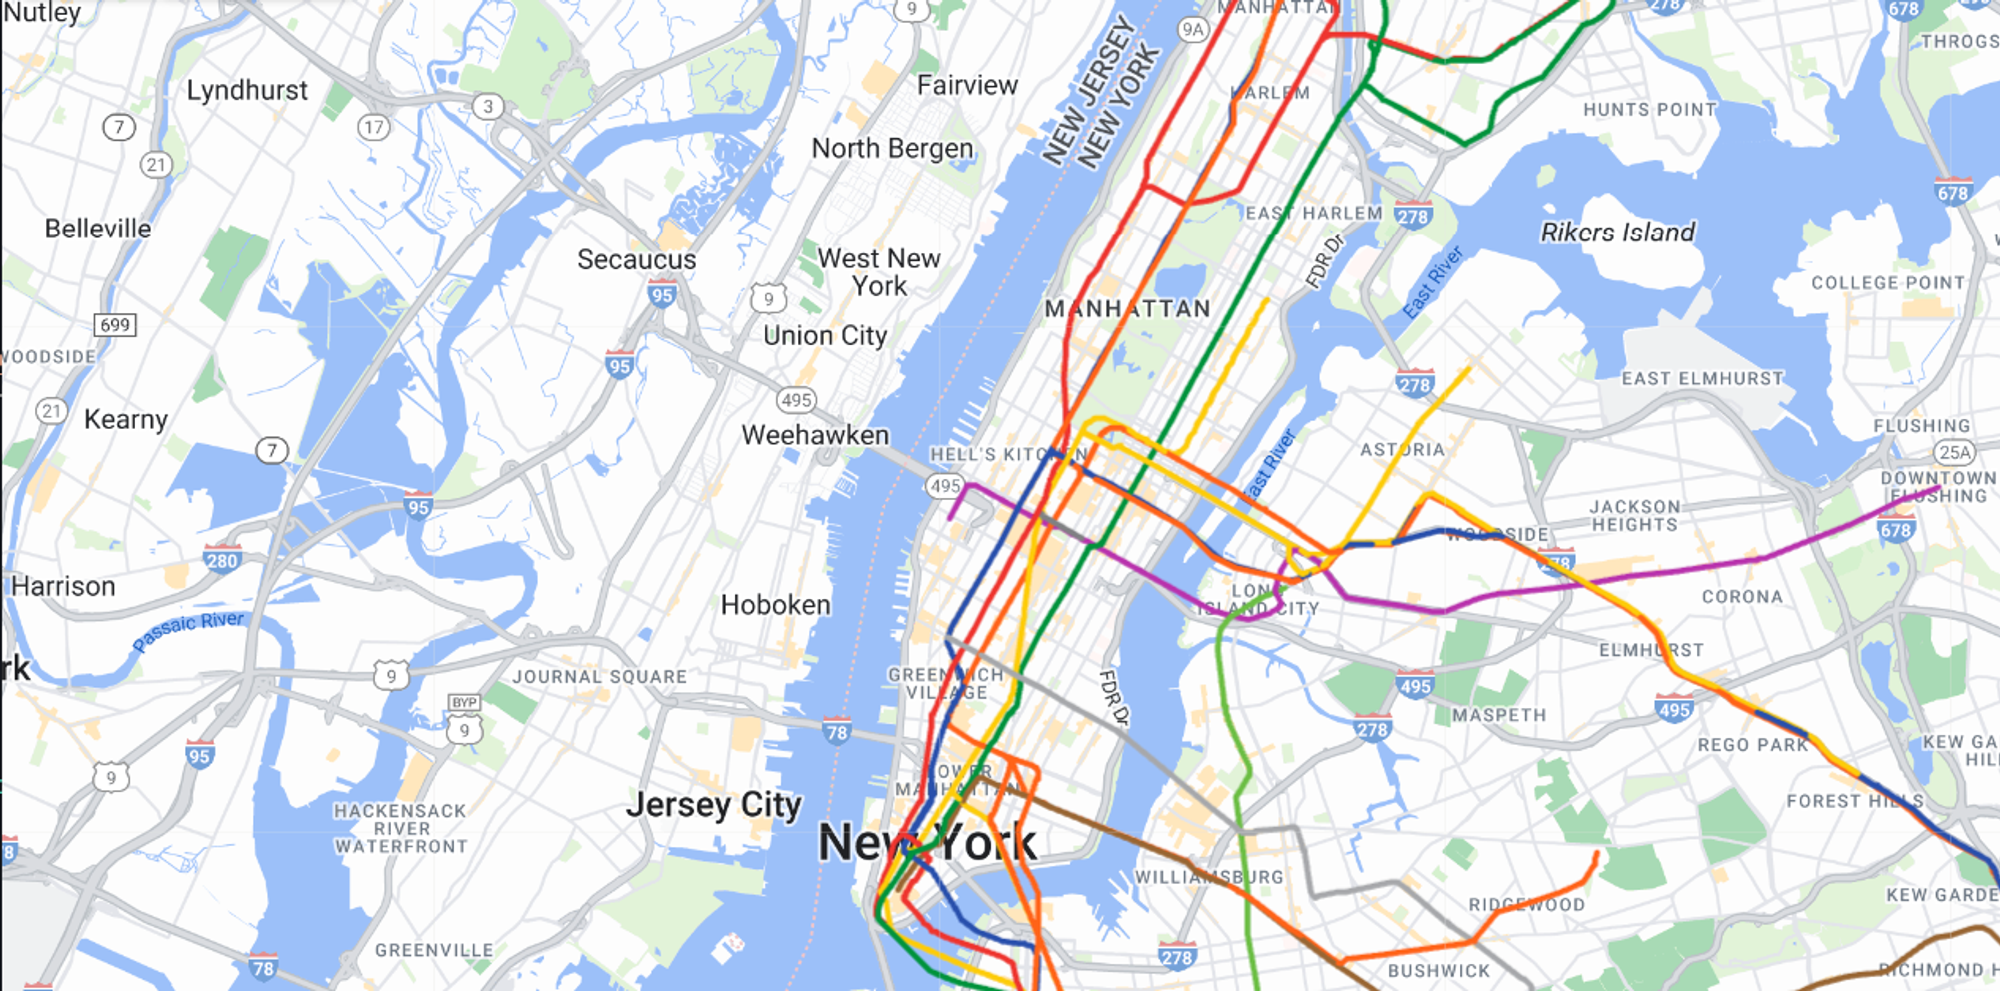
To display continuous subways lines, you’ll need to style each line segment according to its service line color. A quick google session yields the following JSON spec:
const subwayLinesSpec = [
	{
	    "m": "NYCT Subway",
	    "line": "A/C/E",       <----
	    "hex": "2850AD",       <----
	    "pantone": "PMS 286",
	    "cmyk": "c100;m56"
	},
	{...}
]Still, the
line in here contains slashes, the line name in the GeoJSON contains dashes.The hex color lookup utility will thus extract the first line symbol from
name and look for its occurrence in line:export const getLineColor = (name: string) => {
const firstLineLetter = name.split('-')[0];
const hex = subwayLinesSpec.find((c) => c.line.includes(firstLineLetter))?.hex;
return '#' + hex;
};Employing this utility in the
.setStyle() callback:map.data.setStyle((feature) => {
const strokeColor = getLineColor(feature.getProperty('name'));
return {
strokeColor,
strokeWeight: 3,
};
});produces promising results:
Interacting with data layer events
The principles in 3. Interactivity & Events apply to data layers as well.
map.data.addListener('mouseover', (event: google.maps.Data.MouseEvent) => {
	const { feature } = event;
	// the feature corresponds to your line segment

	// now what ???
})
Highlighting a line
In pseudocode, you’ll need to:
- Extract the currently hovered
LineString's line name.
- Iterate all other segments and determine if they “belong” to the same line.
- Update the
strokeWeightandzIndexaccordingly to bring the line to the foreground.
In concrete terms:
map.data.addListener('mouseover', (event: google.maps.Data.MouseEvent) => {
  const segmentLineName = event.feature.getProperty('name');

	map.data.setStyle((feature: google.maps.Data.Feature) => {
    const anyLineName = feature.getProperty('name');

    const isLineHighlighted =
      segmentLineName === anyLineName ||
      anyLineName.includes(segmentLineName.split('-')[0]);

		const strokeColor = getLineColor(anyLineName);
    const strokeWeight = isLineHighlighted
      ? DEFAULT_STROKE_WEIGHT + 3
      : DEFAULT_STROKE_WEIGHT;
    const zIndex = isLineHighlighted ? 100 : 1;

    return { strokeColor, strokeWeight, zIndex };
  });
});
Reverting the highlighting
To undo the highlighting upon
mouseout, you’d simply revert to the default strokeWeight, color, and zIndex:map.data.setStyle((feature: google.maps.Data.Feature) => {
const anyLineName = feature.getProperty('name');
const strokeColor = getLineColor(anyLineName);
return { strokeColor, strokeWeight: DEFAULT_STROKE_WEIGHT, zIndex: 1 };
});Attaching a tooltip
As you’ve learned in Bonus: Positioning a fully custom DOM tooltip, it’s quite easy to covert the mouse cursor’s position at a given latitude & longitude to the corresponding DOM
[x,y] coordinates. The mouseover event exposes the latLng property so placing a custom tooltip becomes an exercise in HTML:export const showLineTooltip = ({
map,
latLng,
lineName,
}: {
map: google.maps.Map;
latLng: google.maps.LatLng;
lineName: string;
}) => {
const { x, y } = fromLatLngToPoint(latLng, map);
const tooltip = document.getElementById('lineTooltip');
tooltip.innerHTML = `
Line ${lineName}
`;
tooltip.setAttribute(
'style',
`position: fixed;
display: block;
font-family: system-ui;
padding: 8px;
border-radius: 8px;
background: ${getLineColor(lineName)};
color: white;
top: ${y}px;
left: ${x}px;`
);
};
// usage
map.data.addListener('mouseover', (event: google.maps.Data.MouseEvent) => {
const segmentLineName = event.feature.getProperty('name');
showLineTooltip({
map,
latLng: event.latLng,
lineName: segmentLineName,
});
});Hiding the tooltip upon
mouseout is equally straightforward:export const hideLineTooltip = () => {
document
.getElementById('lineTooltip')
.setAttribute('style', 'display: none;');
};
// usage
map.data.addListener('mouseout', () => {
hideLineTooltip();
});Putting it all together
The per-feature styling and interactions presented in this chapter are quite handy for lots of typical use cases that don’t involve large datasets.
In the next chapter, we’ll explore more advanced data visualization capabilities with WebGL, Deck.gl, & CARTO.